
TL;DR: A big winter drop in solar panel output is normal: at mid-latitudes panels produce 2-3x more per day in midsummer than midwinter. The seasonal difference widens the further you live from the equator. Heavy overcast days can reduce output to 10-25% of a clear one. The map below shows what is normal for your location.
If your winter output is half, or a third, of your summer peak, your system is almost certainly fine. Solar output follows the sun, and the sun moves a lot through the year, so a big seasonal drop is normal almost everywhere. The size of the seasonal drop depends on your latitude, which is why we have developed the tool below to estimate what is normal for your location and how a cloudy day impacts your solar system.
What is the seasonal solar output where you live?
Tap your location on the map, or press Use my location. The same estimator lives on its own page as the solar output calculator, alongside the rest of our free solar tools, including the battery vs load shifting calculator.


Summer vs winter solar estimator
Tap the map to move the pin, or press "Use my location".
Is my system broken, or is this just winter?
Usually it is just the season, and your latitude sets how big a drop is normal. On clear days the summer to winter gap runs about 1.4x in places like Brisbane, 2x in Melbourne or New York, 3x in London and close to 8x in Stockholm, and winter's extra cloud stretches the seasonal difference further. So a midwinter day at a third of your midsummer peak is completely healthy in northern Europe, but it would be worth investigating if you live closer to the equator. You can see the difference in the tool, tap somewhere on the equator and it's output will be almost unchanged between seasons.
The physics driving the lower output in winter is three effects multiplied together: fewer daylight hours, a lower sun hitting the panels at a shallower angle, and more cloud on top. Multiplied together they turn a 5 kW system's 30 kWh midsummer day into 12 kWh at midwinter.
| Factor | Midsummer | Midwinter |
|---|---|---|
| Day length (45° latitude)[1] | About 15.5 hours | About 8.7 hours |
| Midday sun elevation (45° latitude)[1] | About 68° above the horizon | About 21° above the horizon |
| Panel temperature | Hot cells trim efficiency slightly | Cold cells run a little more efficiently |
| Typical cloud | Region-dependent, often clearer | Region-dependent, often cloudier |
| Net effect at mid-latitudes | Roughly 2-3x more daily energy in summer than winter[2] | |
So when should you actually dig deeper? If your winter days sit well below the curve the tool draws for your location, the usual culprit is shading you never notice in summer. The winter sun rides so low that a tree or chimney throws a shadow several times longer than it does at midsummer, and shade across one panel for part of the morning can drag the whole day down. Check your monitoring on the next clear winter day: a smooth, low arc is weather; sharp steps and notches are shadows.
Tilt is a winter lever. A steeper panel tilt leans your array toward the low winter sun. Try it in the tool's settings: at 45° latitude, moving from 20° to 40° of tilt lifts midwinter output by roughly a third while trimming midsummer by only about a tenth. Roof pitch usually decides this for you, but it is worth knowing which way the trade goes.
What cloudy days really do
Clouds do not switch your system off. They turn it down, and they cause it to fluctuate constantly. On an overcast day a typical system still holds 10-25% of its clear day output, because the panels convert diffuse light (the light that passes through the clouds). Under light or broken cloud it keeps 50-80%, but the curve gets jagged: output dips as each cloud crosses the sun and rebounds seconds later. There is one effect most owners never hear about. Output can briefly jump above the clear sky level when sunlight bounces off the bright edge of a passing cloud and reaches your panels along with the direct beam. Engineers call it cloud edge enhancement[3], and it is why your solar production jumps up on a cloudy day. Flip the cloudy switch in the tool and you can see that spiky texture in the solar curve.
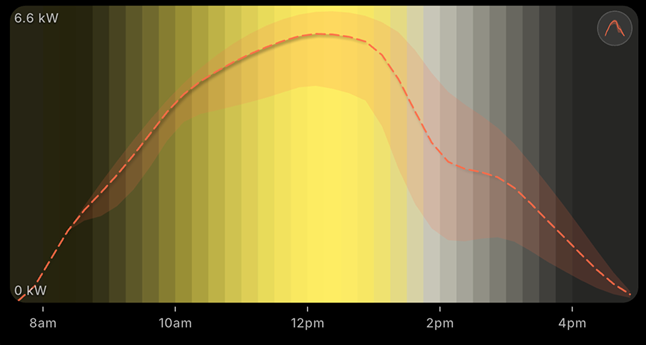
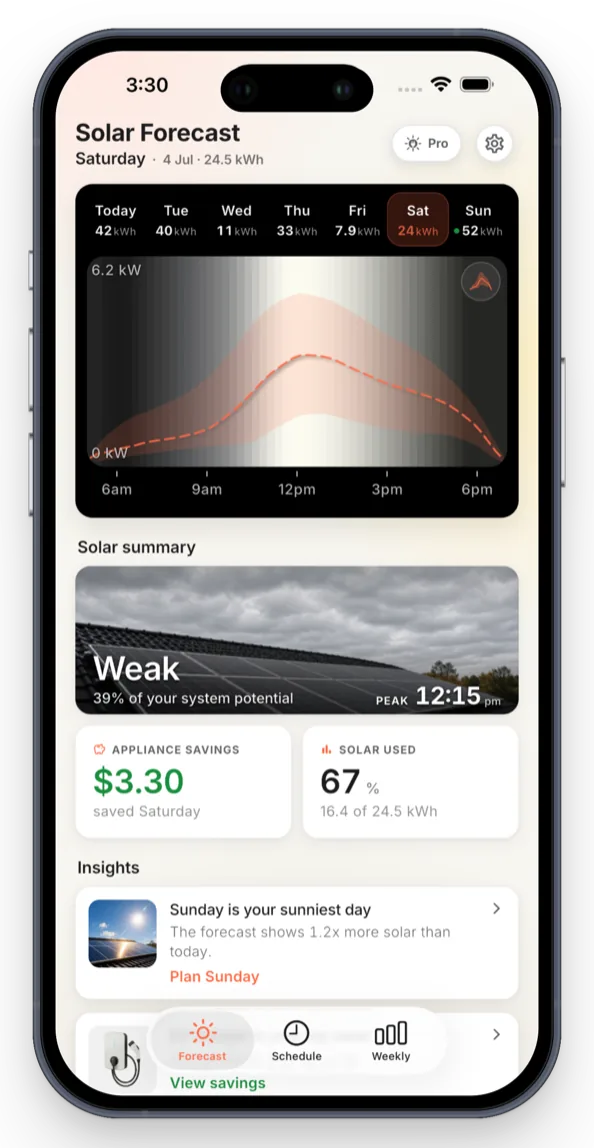
Yesterday's solar generation tells you almost nothing about tomorrow's, this is exactly what our solar forecasts solves. The OnSun App's Solar forcasting models can see the cloud bands moving in days ahead to predict the production curve for your own roof, and helps you use the forecast to use more of your own solar. Download it free on the ios and Android stores today.
What the seasons mean for your bill
The seasons change how you should think about using your solar. In most countries, exporting your surplus earns a small fee while importing from the grid costs several times that, so using your own solar beats exporting it, in summer and winter alike. What changes is precision. Summer's solar window is wide and forgiving, so most appliances fit inside it with room to spare. Winter's peak solar window narrows to a few strong hours around noon, so which appliances you run, and when, has a bigger effect on how much you actually pull from the grid. The tool above shows how narrow that window gets at your latitude, which is the honest way to gauge how much room you have to plan around it.
Winter solar is still there, you just have to plan better to make the most of it.
Managing your solar in summer and winter
The numbers above are not just trivia. They change what you do with your system in each season, and a good app should adapt with you.
In summer the sun is generous and the window is long. You are usually exporting a lot, so the main job is to keep your big loads running midday and to check that a weak day is cloud, not a fault. In winter the picture flips: production is lower and concentrated around noon, the sun sits so low that new shade appears, and a single strong afternoon can make up a large share of your winter month. That is the season where knowing tomorrow's curve matters most, because there is less slack to absorb a miss aligned appliance.
This is where OnSun earns its keep. It builds a personalised production forecast for your exact system and location, then works out the best window to run each appliance against it. The app does not switch anything on or off. It tells you when to run the dishwasher, the dryer or the car, and you decide.
If you are still weighing up what self-consumption is worth in your market, the OnSun Solar Savings Guide walks through the economics, our comparison of feed-in tariffs vs self-consumption covers the export side, and the support page answers setup questions.
Key takeaways
- A winter drop to half or a third of summer output is normal at mid-latitudes; the further you live from the equator, the bigger the normal gap.
- Cloudy days still generate: 50-80% of clear-sky output under light cloud, 10-25% under heavy overcast, with spiky 5-minute swings in between.
- If winter output falls well below what is normal for your latitude, suspect low-sun shading: a smooth low curve is weather, sharp notches are shadows.
- Winter narrows the useful solar window to the hours around noon, which makes knowing tomorrow's curve more valuable, not less.
References
- GlobalNOAA Global Monitoring Laboratory, Solar Calculator. Day length and midday sun elevation for any latitude and date; the 45-degree figures in the table are the solstice values it returns. Back to text
- GlobalEuropean Commission Joint Research Centre, PVGIS. Free month-by-month PV output estimates for any location worldwide, an independent check on the seasonal swing described here. Back to text
- Peer-reviewedMol, van Stratum, Knap & van Heerwaarden, Reconciling observations of solar irradiance variability with cloud size distributions, Journal of Geophysical Research: Atmospheres 128 (2023). Cloud edges locally push irradiance above the clear-sky level, and these enhancements happen about as often as cloud shadows. Back to text
The cloudy-day retention figures (10-25% of clear-day output under heavy overcast, 50-80% under light or broken cloud) and the city-by-city summer-to-winter ratios are modelled with the same clear-sky and broken-cloud model that powers the estimator above, for an unshaded roof at a 90% performance ratio. They are indicative ranges, not measurements: cloud type, thickness and local climate move them. Every OnSun savings and output figure is an estimate, never a guarantee.